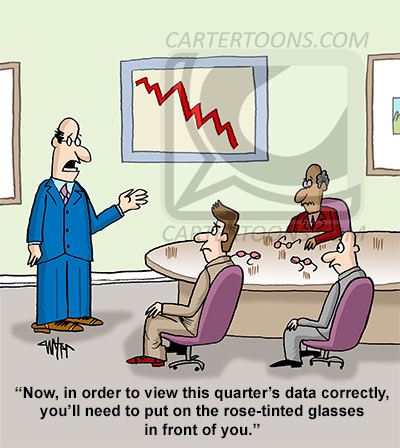
This month’s data driven cartoon for All Analytics deals with predictive analytics, and the fact that, even with all the information we have, sometimes we can’t see the forest for the trees. Click over to A2 to see it on their site.

Similar Posts
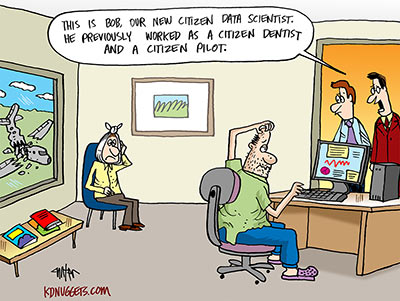
KDNuggets – March Cartoon
My latest cartoon for the excellent data news supersite KDNuggets has just posted for March! Check it out here!
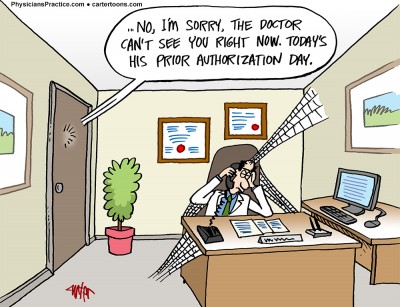
Physician’s Practice – August Cartoon
This month’s Physician’s Practice online cartoon deals with the bane of every physician’s existence: prior authorization. Health insurance companies have made it difficult for doctors to get their patients the medicine and procedures they need in a timely fashion for the simple, ugly fact that it cuts into the insurance company’s profits. I did this…
Modern Analyst – July Cartoon
July cartoon for Modern Analyst posted this sunday. Be sure to visit them regularly for all the latest data and business intelligence news!
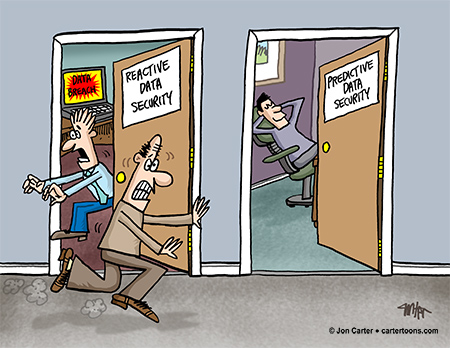
Modern Analyst – November Cartoon
This month’s cartoon featured on Modern Analyst deals with how we handle the security of our increasingly important and sensitive data pools, and what turns out to be more of a reactionary stance at data security, than proactive. Just ask Target and a few other high profile businesses how prepared they were for their breaches…

Reader’s Digest – April Cartoon
My latest appearance in Reader’s Digest is in this month’s issue, April 2018, so get a copy at any major retailer, or subscribe at RD.com.

Diagnostic Imaging – June Cartoon
A little behind getting my blog posts updated, but here is the June installment for Diagnostic Imaging. If you’re a radiologist, or in a related medical field, be sure to check out their site, which posts news and fresh content daily!