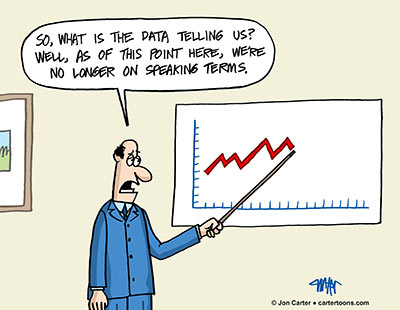
This month’s data driven cartoon for All Analytics deals with predictive analytics, and the fact that, even with all the information we have, sometimes we can’t see the forest for the trees. Click over to A2 to see it on their site.

Similar Posts
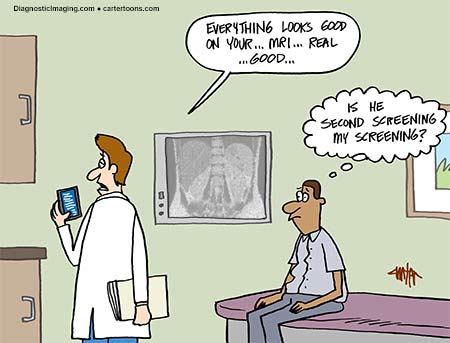
Diagnostic Imaging – November Cartoon
My latest cartoon just posted on Diagnostic Imaging, so head over there to get a better look at my cartoon about second screening. Yes, this phenomenon doesn’t just happen when we’re at home! If your physician does happen to be doing this while performing… say, a … rectal exam or something of that nature, you…

Medical Economics – August Cartoon
My August cartoon has just posted on the Medical Economics website, and it’s another jab at the one and only Donald Trump. This cartoon marks the beginning of my new partnership with Medical Economics on both their website and in their print magazine. Medical Economics has been the premier news source for physicians and medical…
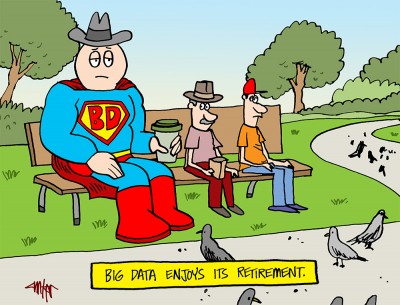
KD Nuggets – September Cartoon
My data new cartoon for September is up on KD Nuggets! This one deals with the retirement of the (now old) term “big data.” Click over to the site to check out the cartoon on the KD Nuggets site🙂
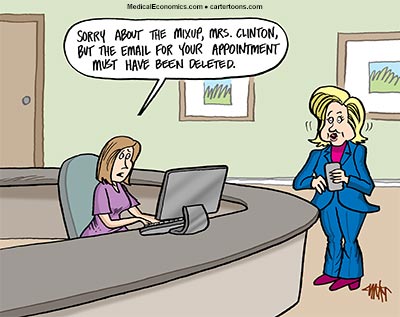
Medical Economics – Sept. Cartoon
Hillary’s email problems have followed her from the not-so-hallowed corridors of Washington corruption to her doctor’s office. Check out my latest cartoon at Medical Economics.
Modern Analyst – March Cartoon
My newest cartoon has posted to the business analytics site, Modern Analyst – check it out here!

Diabetes Mine- July Cartoon
My latest contribution to Diabetes Mine’s Sunday Funnies section is out today: