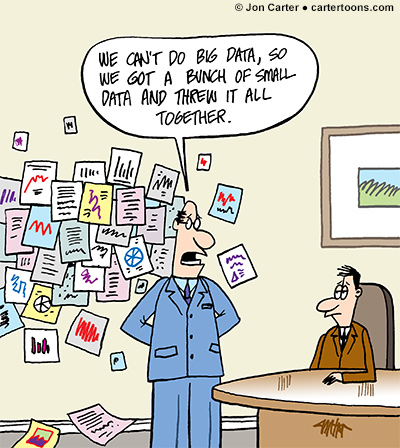
This month’s data driven cartoon for All Analytics deals with predictive analytics, and the fact that, even with all the information we have, sometimes we can’t see the forest for the trees. Click over to A2 to see it on their site.

Similar Posts
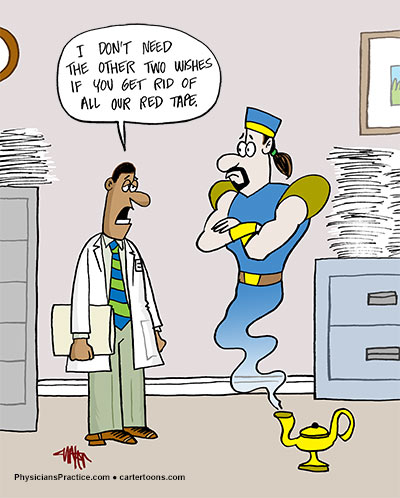
Physicians Practice – June Cartoon
Physicians and other medical specialists probably wish this on a daily basis! Check out the latest cartoon on Physicians Practice, along with other great daily content they offer the medical community:)
Modern Analyst – August Cartoon
Check out my latest data cartoon published on Modern Analyst.

Psychiatric Times – August Cartoon
One of my psychology/medical cartoons has just posted to Psychiatric Times, which I’ve been contributing to since last year. You can also check out the archive of cartoons I’ve published across most of the United Business Media websites here.
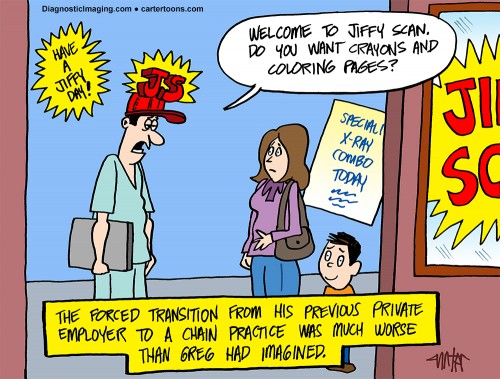
Diagnostic Imaging – September Cartoon
My first cartoon for September’s Diagnostic Imaging comics section just posted Friday. This one deals with the trending topic of commoditization in healthcare, kind of a commentary of our society’s cheap, throw-away mentality. Head over to DI for a minute and check out the full resolution cartoon 🙂

Psychiatric Times – September Cartoon
My latest cartoon for Psychiatric Times has just posted this Monday. And on Labor Day, I offer a nice little workplace cartoon dealing with two things that go hand-in-hand: emails and rage. Check out the site for the full resolution cartoon. Have a great weekend 🙂

Physicians Practice – April Cartoon
The first cartoon for this month’s Physicians Practice offering has just posted to their site. This one deals with the vague descriptions some patients may give their physicians about prescription drug side effects. Enjoy the rest of your weekend, everybody:)